Research note
TrialForge tracks IQVIA trends within 2 percent, and adds the 40 to 50 percent of China's industry trials that ClinicalTrials.gov does not hold
With TrialForge, your teams have access to the latest in global clinical trial trends
TrialForge Research, September 2026.
Download the PDFA daily updated database that lands beside IQVIA's report
About 40 to 50 percent of China's industry trials are not on ClinicalTrials.gov, and TrialForge reads them, while landing within 2 percent of IQVIA's 2024 count of clinical trial starts.
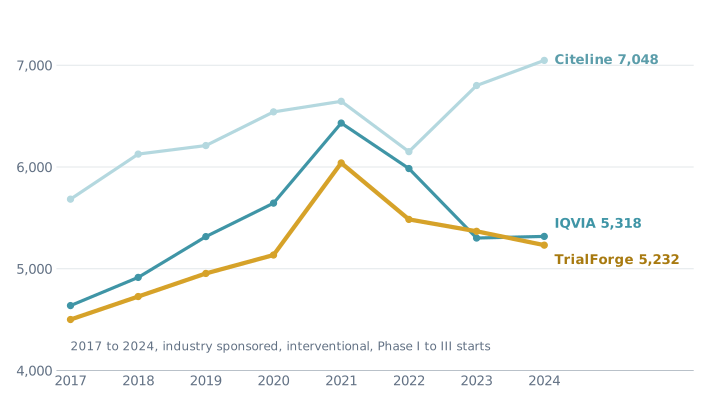
- TrialForge, built independently from public registries, averages 95 percent of IQVIA's count of trial starts across 2017 to 2024 and sits within 2 percent of it in 2023 and 2024.
- IQVIA and Citeline, both counting the same cut of Citeline's Trialtrove, differ by 32.5 percent in 2024: 5,318 against 7,048 trial starts.
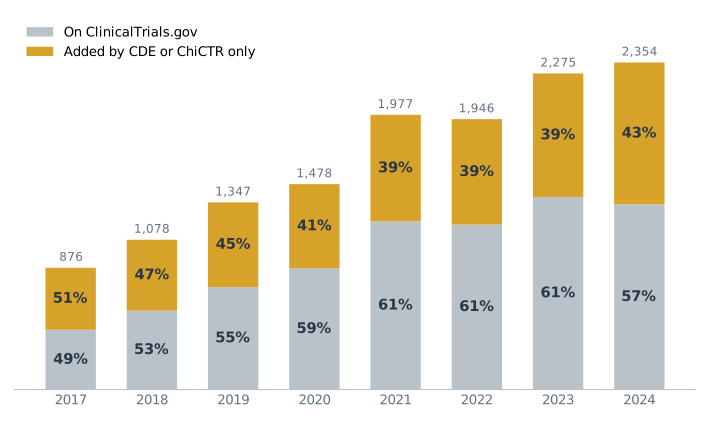
- In 2024, 1,021 of China's 2,354 industry trial starts came only from CDE or ChiCTR.
TrialForge gives you global clinical trial data from the source registries, with conditions, drugs and sponsors resolved to standard terms. It is strongest in China, where the data is hardest to reach.
TrialForge figures shown are counts of clinical trial starts, industry sponsored, interventional, Phase I to III, drug trials, read 28 to 29 September 2026. Every competitor figure is from IQVIA Global Trends in R&D 2025 or Citeline Clinical Trials Roundup 2025.
Follows IQVIA's global trends and lands within 2 percent in 2023 and 2024
Exhibit 1. TrialForge tracks IQVIA closely in both level and trend
Source: TrialForge database, read 29 September 2026; IQVIA Institute, Global Trends in R&D 2025, Exhibit 9; Citeline, Clinical Trials Roundup 2025, Table 2, page 4.
TrialForge follows IQVIA's global trend in trial starts: a spike during COVID, peaking in 2021, then the well known industry slowdown from 2022 to 2024. It averages 95 percent of IQVIA's count across the period and is within 2 percent in 2023 and 2024. IQVIA and Citeline count the same cut of Trialtrove, yet differ by 33 percent in 2024, because Citeline alone climbs after 2022.
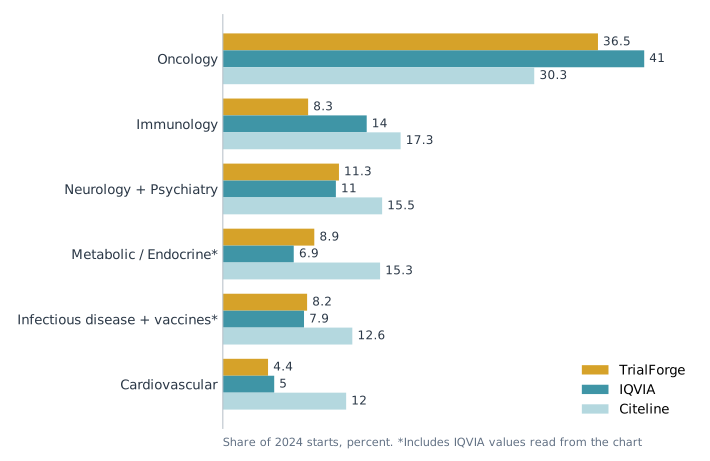
Exhibit 2. TrialForge and IQVIA agree on the shape of the pipeline across most therapeutic areas
Source: TrialForge database, 2024, 4,818 trials, read 28 to 29 September 2026; IQVIA, Global Trends in R&D 2025, Exhibit 15; Citeline, Clinical Trials Roundup 2025, Figure 3, 2024.
TrialForge is similar to IQVIA across therapeutic areas. Oncology leads in every source: Citeline 30.3 percent, TrialForge 36.5, IQVIA 41. Neurology and psychiatry (11.3 against 11), infectious disease (8.2 against 7.9) and cardiovascular (4.4 against 5) line up closely, and metabolic (8.9 against 6.9) is within two points. TrialForge carries eighteen therapeutic areas against IQVIA's eleven, a finer view of the same pipeline.
Citeline counts trials in multiple therapeutic areas: 7,560 area counts against 7,048 trials.
About 40 to 50 percent of China's industry trials are not on ClinicalTrials.gov
Exhibit 3. CDE and ChiCTR supply about 40 to 50 percent of China's industry trials, and TrialForge reads both
Source: TrialForge database, China located, read 28 to 29 September 2026; ClinicalTrials.gov; CDE registry; ChiCTR.
China's industry trial starts nearly tripled between 2017 and 2024, from 876 to 2,354. A ClinicalTrials.gov based view captures roughly half to six tenths of them. In every year since 2017 the CDE and ChiCTR supply the rest, about 40 to 50 percent of the total. In 2024 that was 1,021 trials. Nearly all come from the CDE, the registry run by China's National Medical Products Administration. The most recent read, beyond the chart, is 46.5 percent for 2025.
A clean, modern clinical trial registry
We read ClinicalTrials.gov, CDE and ChiCTR today, and we will read all registries by the end of 2026. Each trial arrives cleaned and resolved, so you do not have to do the work.
Method
Trials are industry sponsored, interventional, Phase I to III, by start year, planned or actual. As in IQVIA's Global Trends in R&D 2025, Phase II includes Phase I/II and Phase III includes Phase II/III, terminated trials are included, and device only trials are excluded, which we apply by requiring at least one drug intervention. Sources are ClinicalTrials.gov, CDE and ChiCTR, read 28 to 29 September 2026. Exhibit 1 counts every such trial. Exhibit 2 uses 4,818 trials, healthy volunteer studies removed. Five of IQVIA's therapeutic area values are printed and six are read from the chart. This paper uses the 2025 vintage of IQVIA's report throughout, for consistency.1 It stops at 2024 because that vintage does, and because we are auditing our own historical figures.
1. IQVIA's February 2026 report shows 6,527 starts for 2024, where this paper prints 5,318. IQVIA revised its methodology in January 2026, widening how it identifies interventional trials and excluding bioequivalence trials of generics, biosimilars and natural products. It reports that "total trial starts were higher overall than those identified with the previous methodology", by 10 percent in total over the prior five years.
Sources: TrialForge database (ClinicalTrials.gov; CDE registry; ChiCTR), read 28 to 29 September 2026; IQVIA Institute, Global Trends in R&D 2025, Exhibits 9 and 15; IQVIA Institute, Global Trends in R&D 2026, methodology appendix, for the footnote only; Citeline, Annual Clinical Trials Roundup 2025 Edition, Table 2, Figure 3 and footnote 2.
Request a discussion
We will send sample data to your inbox and set up a time to talk.